HCI Research Experience at Looking Glass Lab
Where/When WUSTL Kelleher Lab. Summer 2017.
Link http://.../~annielee/BehaviorVisualization/behavior_visualization.html
GoalTo individualize learning experiences through modifying difficulty of code puzzles using machine learning algorithm
MotivationTechnology is advancing quickly and we need more computer scientists in the workforce. To do so, early teaching of coding skills is important, but around the greater St. Louis area the number of computer science educators is dropping quickly because of so much opportunities with a CS degree. To provide more accessible coding education, the Looking Glass team made a program that teaches fundamental coding concepts, yet still cannot emulate human educators. What make human educators so special is their ability to provide individualized learning experiences, such as providing easier problem sets if a student is struggling.
Method
- Find a new feature to add onto our current machine learning algorithm to better predict user performances.
- To achieve this, analyze HCI log files that has all the information about drags and clicks from turning on the program and exiting the program.
- The log files consist of timestamps, drags, clicks, and current puzzle status.
- Use python and regex to parse data into different stages of puzzles and extract that info into excel files.
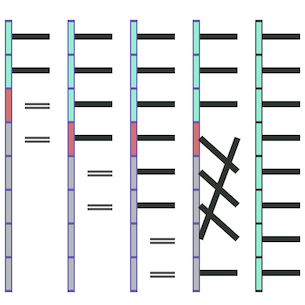
- Use the excel files to draw meaningful visualization of puzzle progress.
- I focused on how users behave after they watch the correct animation. The visualization can be found in the link provided above.
- My visualization indicated that some users notice a bug immediately after watching the solution, while others struggle to find the problem and repetitively get the same thing incorrect.
- I counted up using python and those excel files how many times users get the same incorrect solution after watching the solution.
- That feature was added to the random forest decision split.

Project SPiNE
Where/When ArchHacks, hackathon held at WUSTL. October 2017.
Award Runner-up for best overall hack, Biggest world impact, Best domain name
Link https://devpost.com/software/spine
Goal To make diagnose of pelvic rotation and scoliosis more affordable and accessible for people
Motivation Many are suffering from scoliosis and most incidences can be easily cured through stretching, if diagnosed earlier in the stage. However, diagnose of such is expensive and time consuming for most people because currently, the only way to diagnose is through X-rays, CT scans, and MRI. And if not treated at an early stage, it will develop into a severe pelvic rotation that might be even more costly.
Method Using multithreading of two accelerometers of Arduino, we gather the user data. Then we process the data in Java adopting linear and quadratic regressions, extracting the estimation of user's pelvic rotation. Then using PHP, we connect this data with the user interface built in Javascript and CSS.
Next Steps Reliability research and connect with sponsors
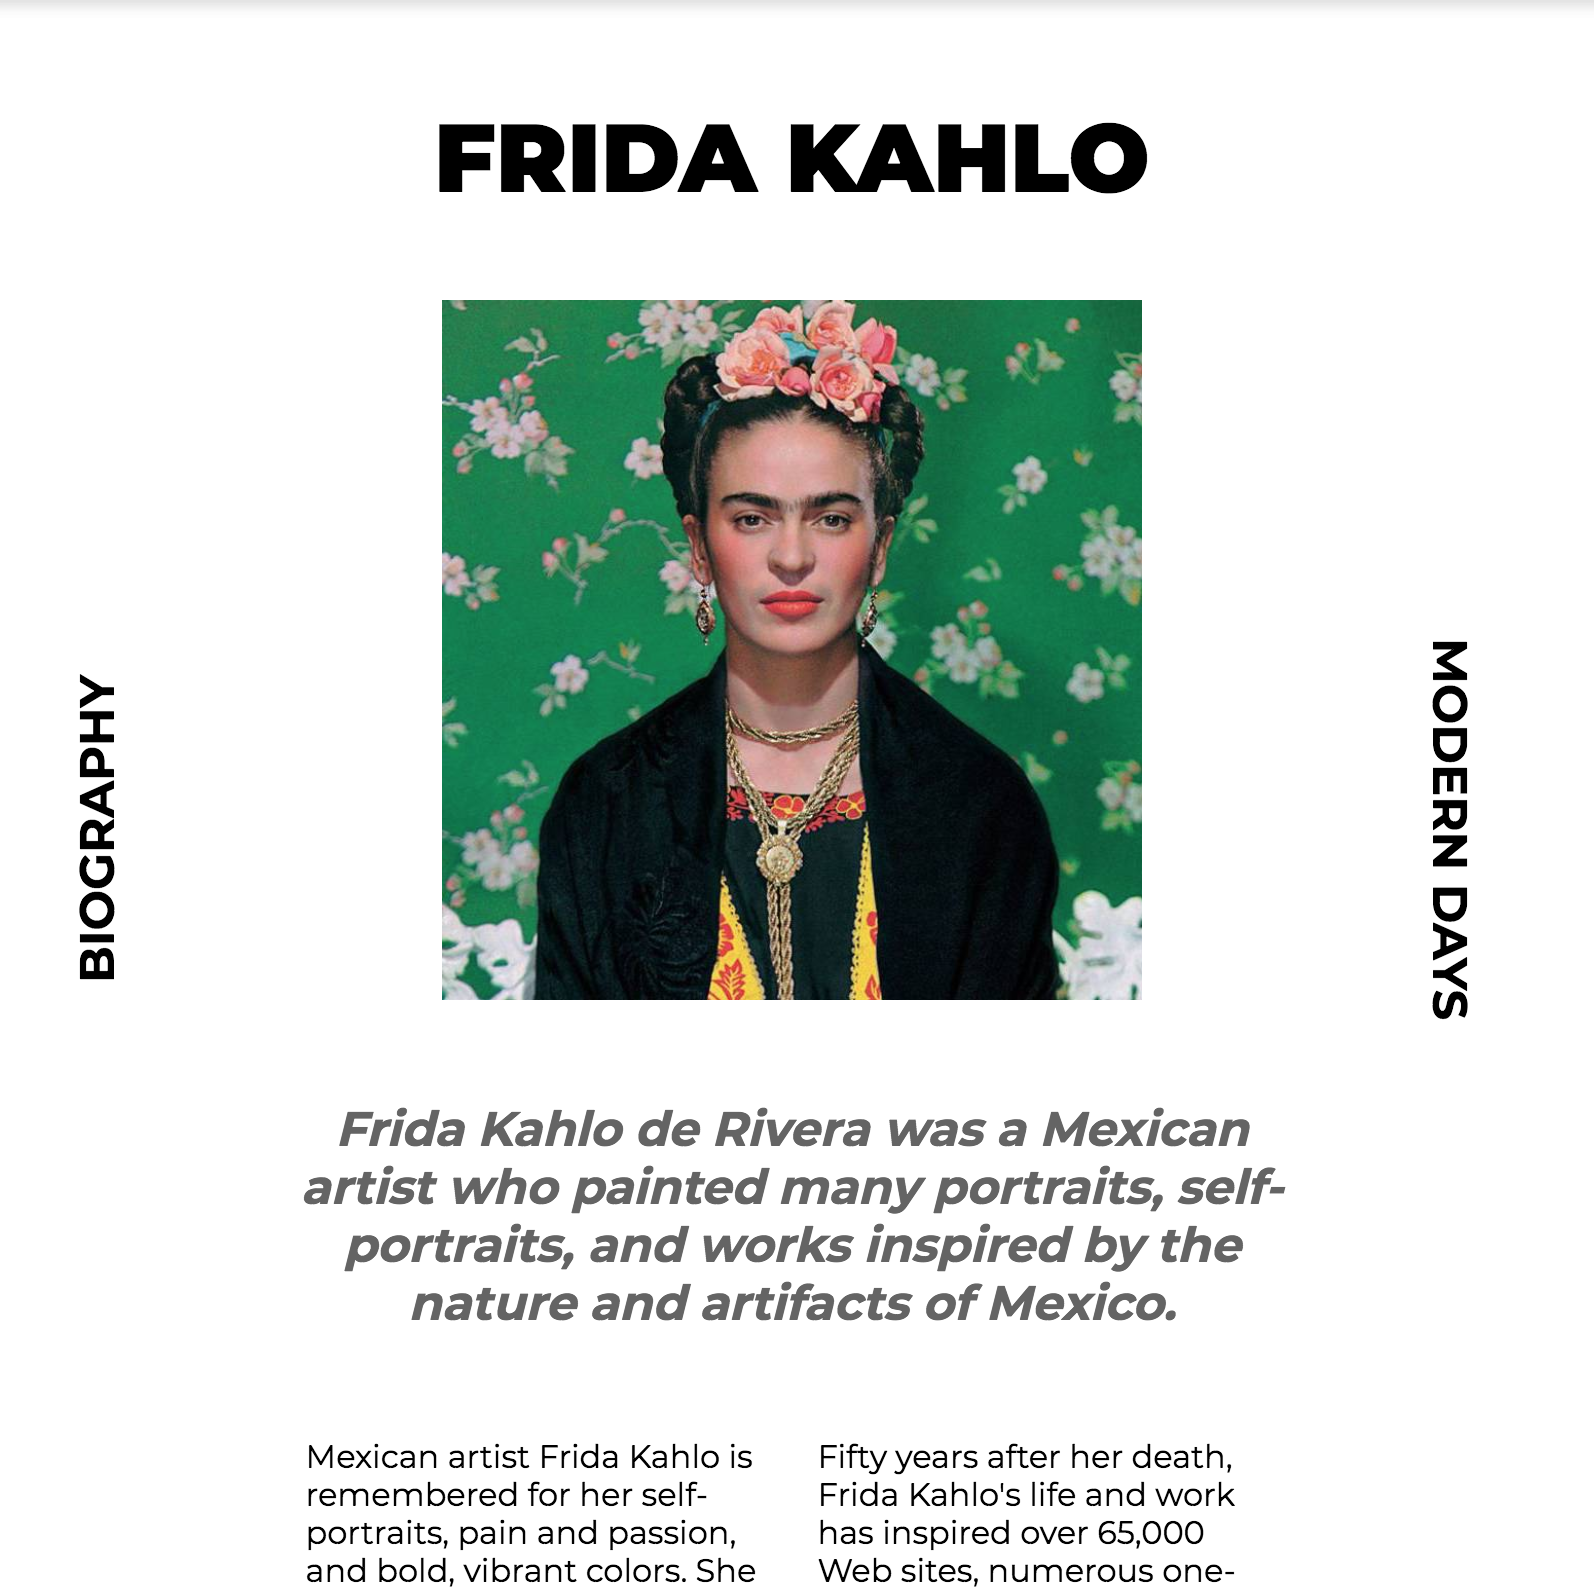
Communication Design: Interaction Foundations
Where/WhenSam Fox Course. Spring '18
AboutDesigned websites, exploring user-interactions that add bidirectionality to communication.
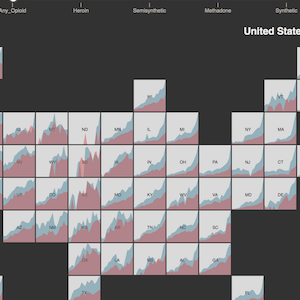
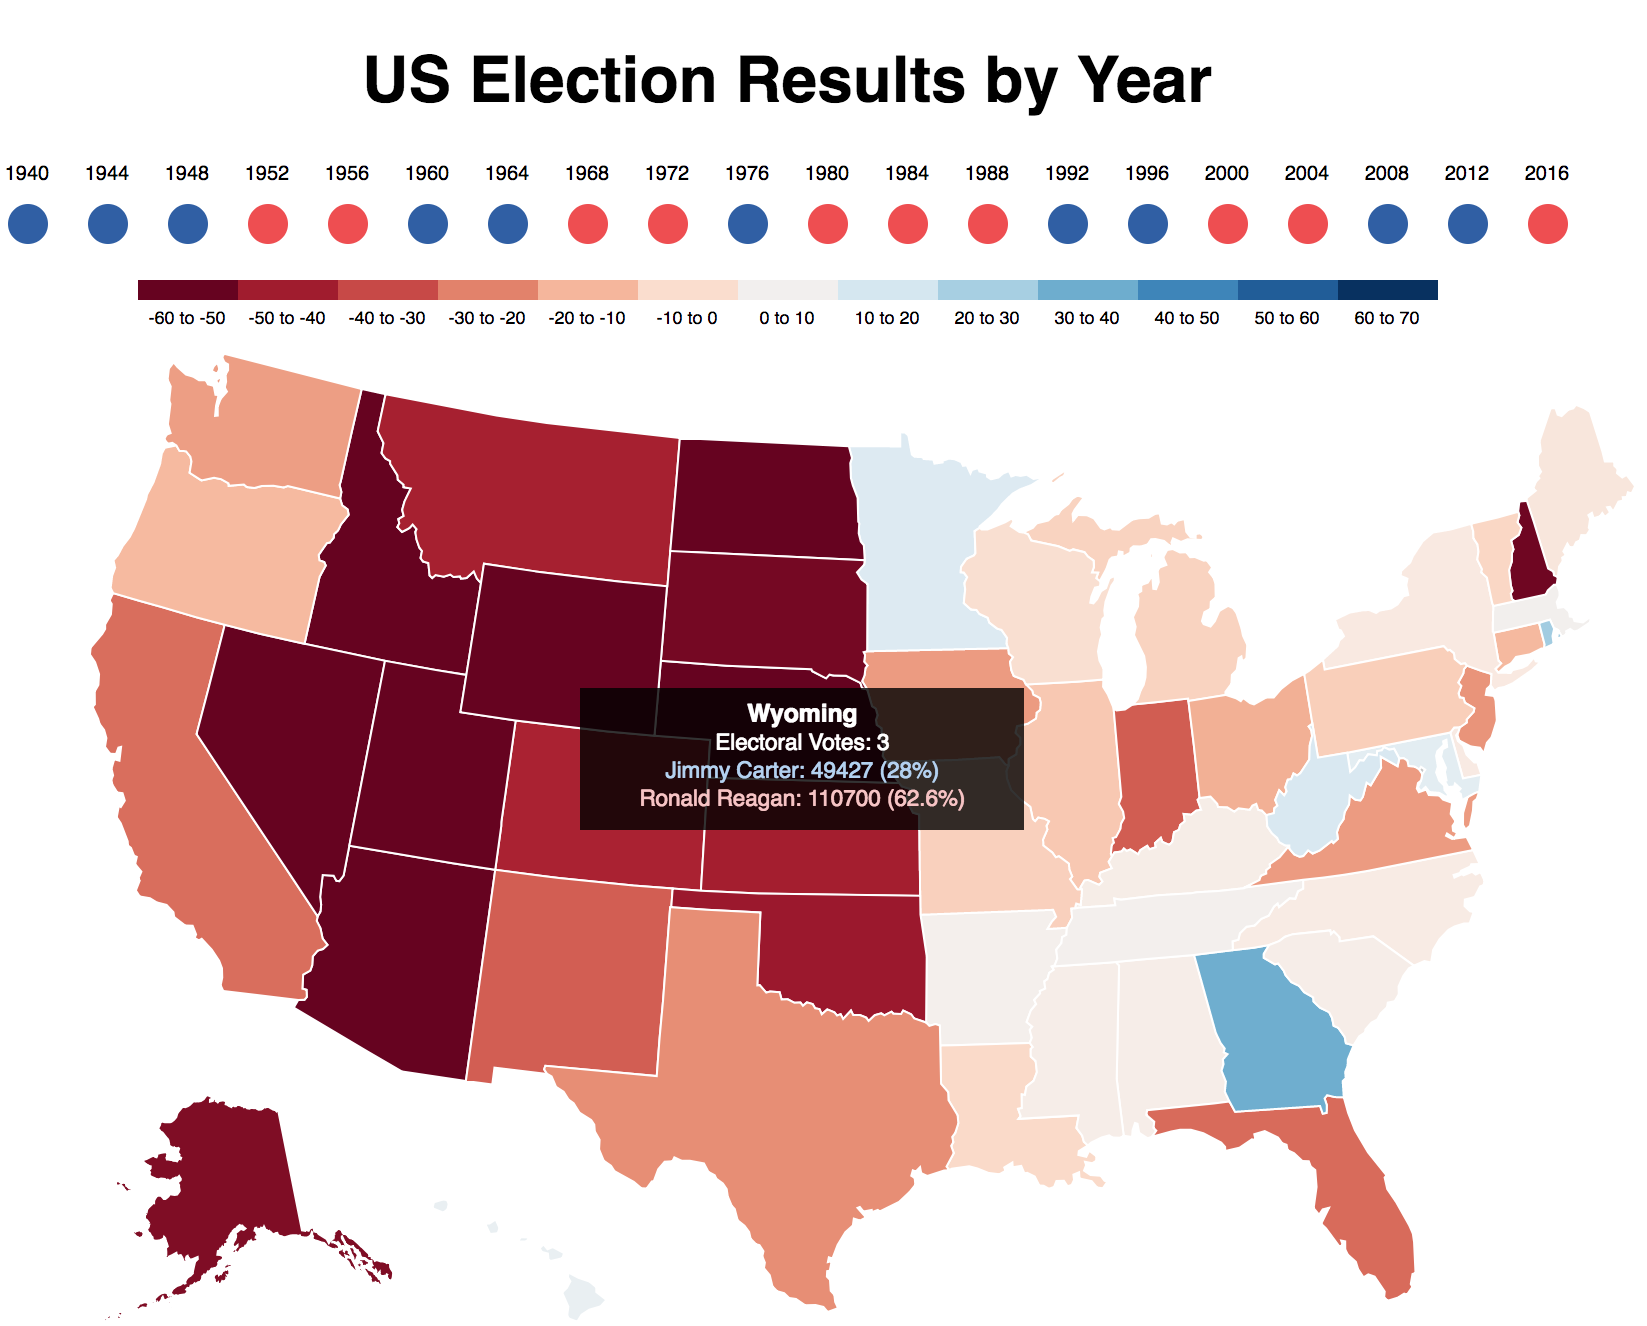
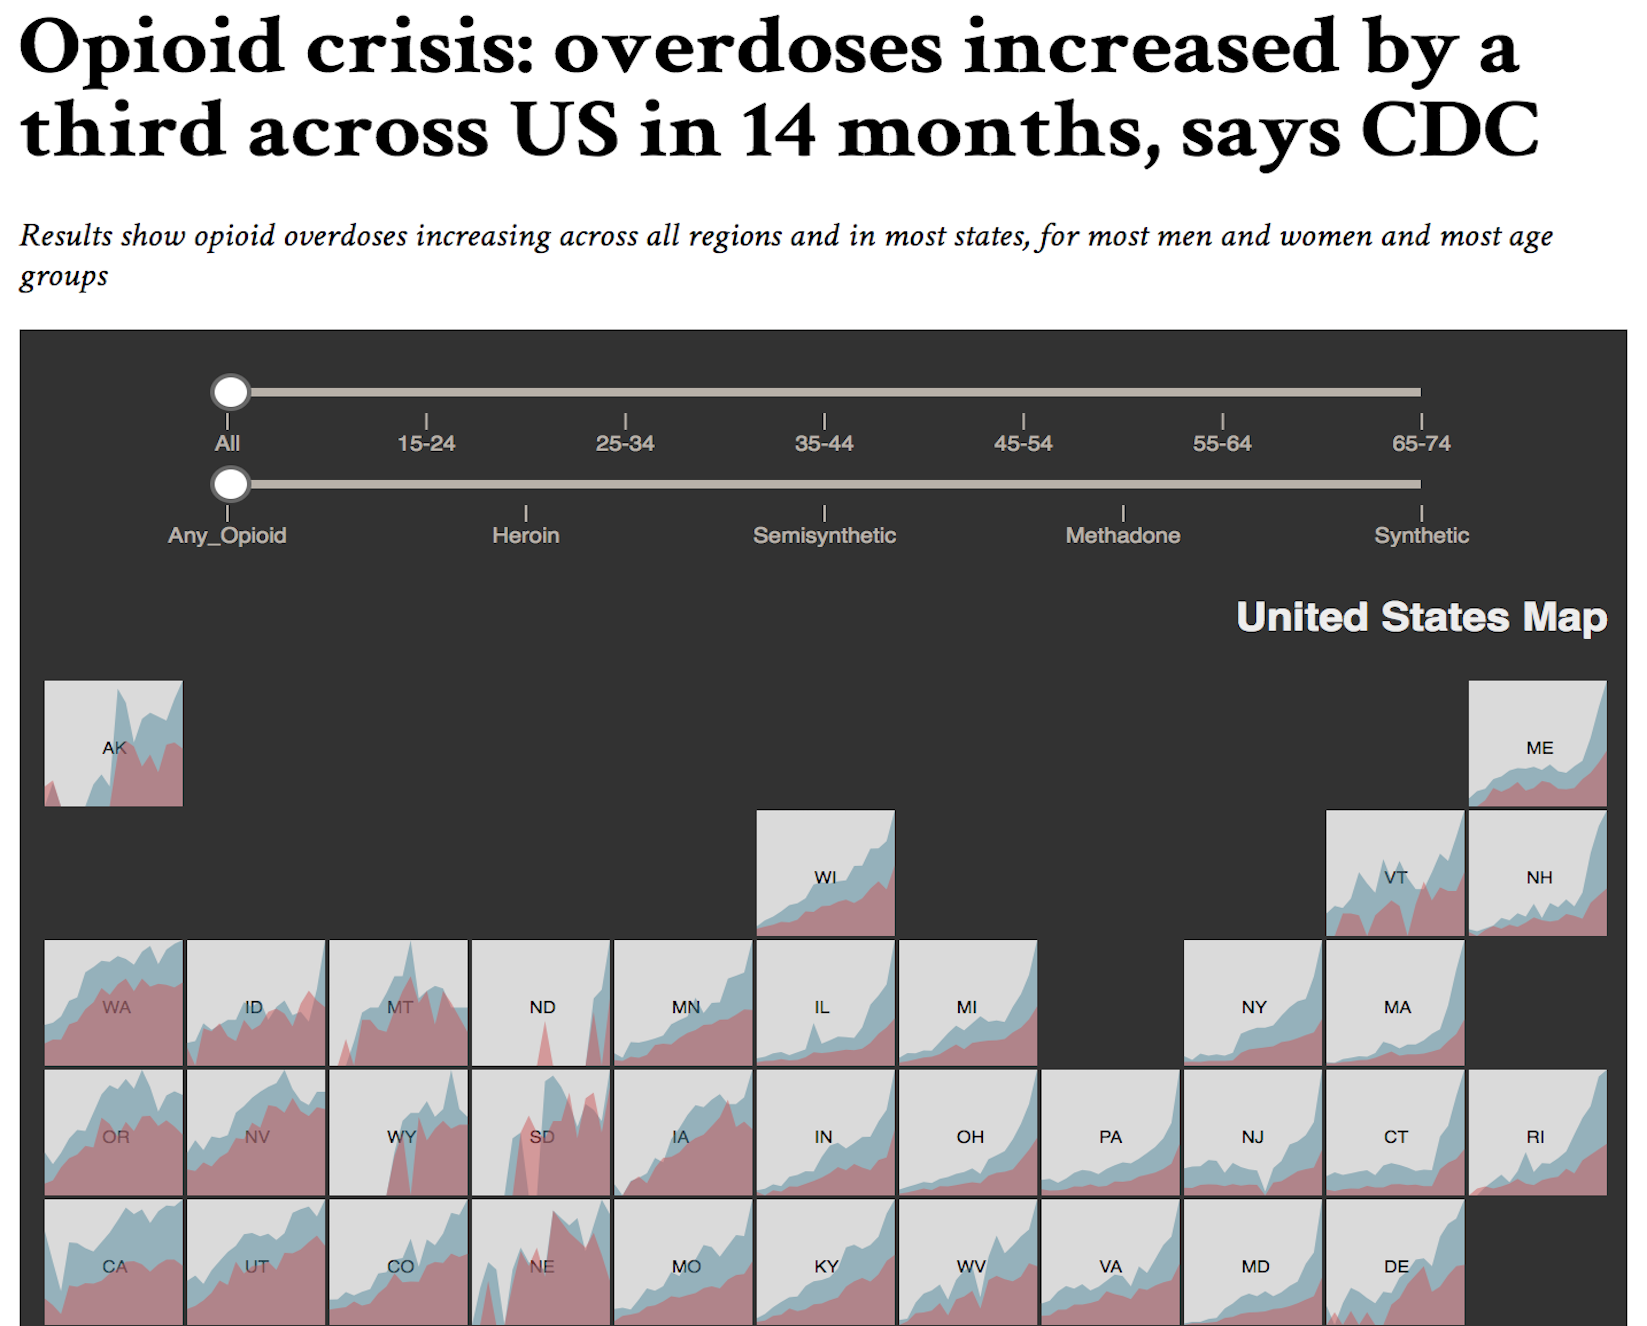
Information Visualization
Where/WhenWUSTL CSE557. Spring '18
AboutExplored ways of visualizing data to deliver information more effectively.
Machine Learning Application Project: Wine Rate Predictor
Where/WhenAdvanced Machine Learning. Spring '18
Githubhttps://github.com/jsha0313/cse517project/wiki
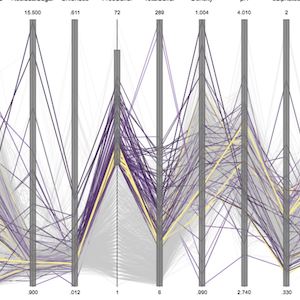
Dataset Visualizationhttps://www.openprocessing.org/sketch/516216
GoalUsing various machine learning models learned in class, our team proposed to find a model that can reliably predict wine’s quality solely from its chemical components. With the best performing algorithm, we can further develop an app that many wine consumers including chefs, restaurant owners, and hotel managers can use to select their choice of wine and evaluate through just taking a picture of a label.
MotivationComing from a country with the highest alcohol consumption rate, our team decided as a whole to experiment and analyze the wine dataset imported from UCI Machine Learning Repository.
Models Explored
- Logistic Regression
- AdaBoost
- Decision Tree
- Random Forest
- Gaussian Process
- Kernel SVM
- DNN Regressor
- Clustering
